Mandelbrot Set Viewer in Rust and Wasm
7 min read
Mandelbrot Set is one of the fascinating objects in mathematics, as it has an easy definition but the result is extremely complex. This blog explores it by implementing a viewer in Rust, Wasm and Typescript
This project was inspired by an excellent list of challenging projects shared here. It's an ideal opportunity to sharpen my Rust programming skills while also diving into WebAssembly. And it's also my first Blog post 🎉, you can access the deployed site at this link
Mandelbrot set is one of the fascinating objects in mathematics, as it has an easy definition but the result is extremely complex. Its beautiful nature not only inspired mathematicians, but also artists, like David Hockney for a painting and John Updike in some pages.
Zooming in you can find copies of itself, seahorse structures, spirals, islands and many other interesting structures. "It illustrates how profound intricacy can emerge from the simplest of rules — much like life itself" 1.
The formal definition states that it is the set obtained from the quadratic recurrence equation with , where points for which the orbit of does not tend to infinity are in the set 2 . This means that a complex number belongs to the set if, when starting from and applying the iteration, remains bounded .
Since I am not a mathematician, I don't want to spend too much time on the mathematical details right now and I'll skip directly to the plotting algorithms, starting from the simplest one, the Escape time algorithm.
Escape Time algorithm
This algorithm determines how quickly the sequence escapes to infinity for each point of the complex plane. It assigns a color to each pixel based on the number of iterations it takes for the magnitude of to reach a certain threshold. The algorithm can be written like this:
    for (p_x, p_y) in pixels:
        x_0 = scale(x)
        y_0 = scale(y)

        iteration = 0

        while x**2 + y**2 < 4 and iteration < max_iteration:
            x_temp = x**2 - y**2 + x_0
            y = 2*x*y + y_0
            x = x_temp
            iteration = iteration + 1

        color = palette[iteration]
The values are checked during each iteration to see whether they have reached a critical "escape" condition, or "bailout". If that condition is reached, the calculation is stopped, the pixel is drawn, and the next x, y point is examined. For values within the Mandelbrot set, escape will never occur, so a bail condition (in the pseudo code ) should be set.
With this simple algorithm, this is the result:
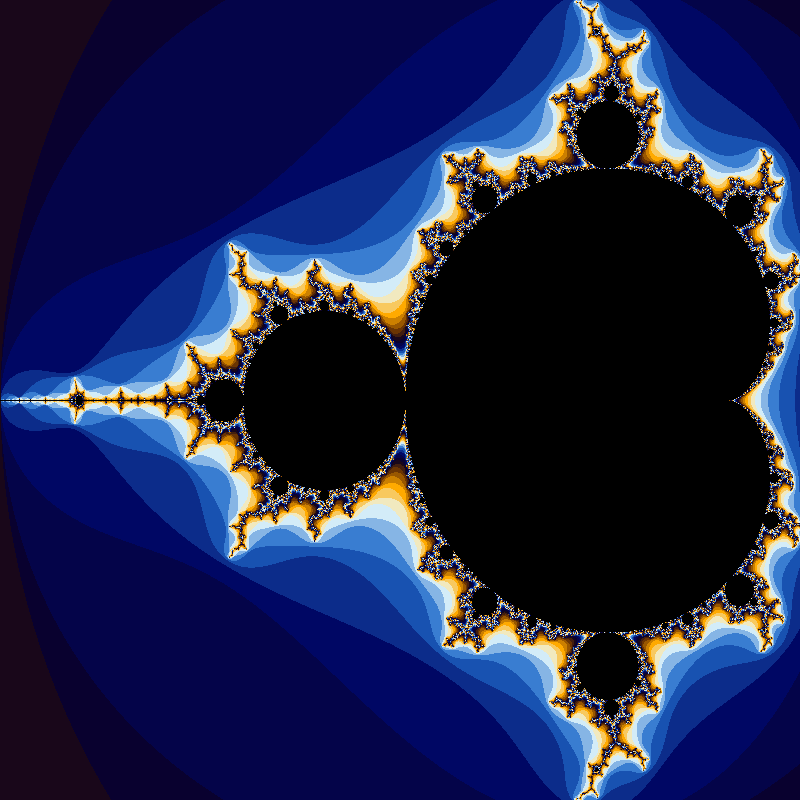 As can be seen, this simple method creates some bands of color, which are not attractive as the smooth colors. The problem is that the number of iterations until escape is an integer, resulting in a stair-step function. It is sufficient to transform the iteration count like this:
where is the iteration count found by the naive escape algorithm and its the norm of the complex number at exit.
The result is the following:
As can be seen, this simple method creates some bands of color, which are not attractive as the smooth colors. The problem is that the number of iterations until escape is an integer, resulting in a stair-step function. It is sufficient to transform the iteration count like this:
where is the iteration count found by the naive escape algorithm and its the norm of the complex number at exit.
The result is the following:
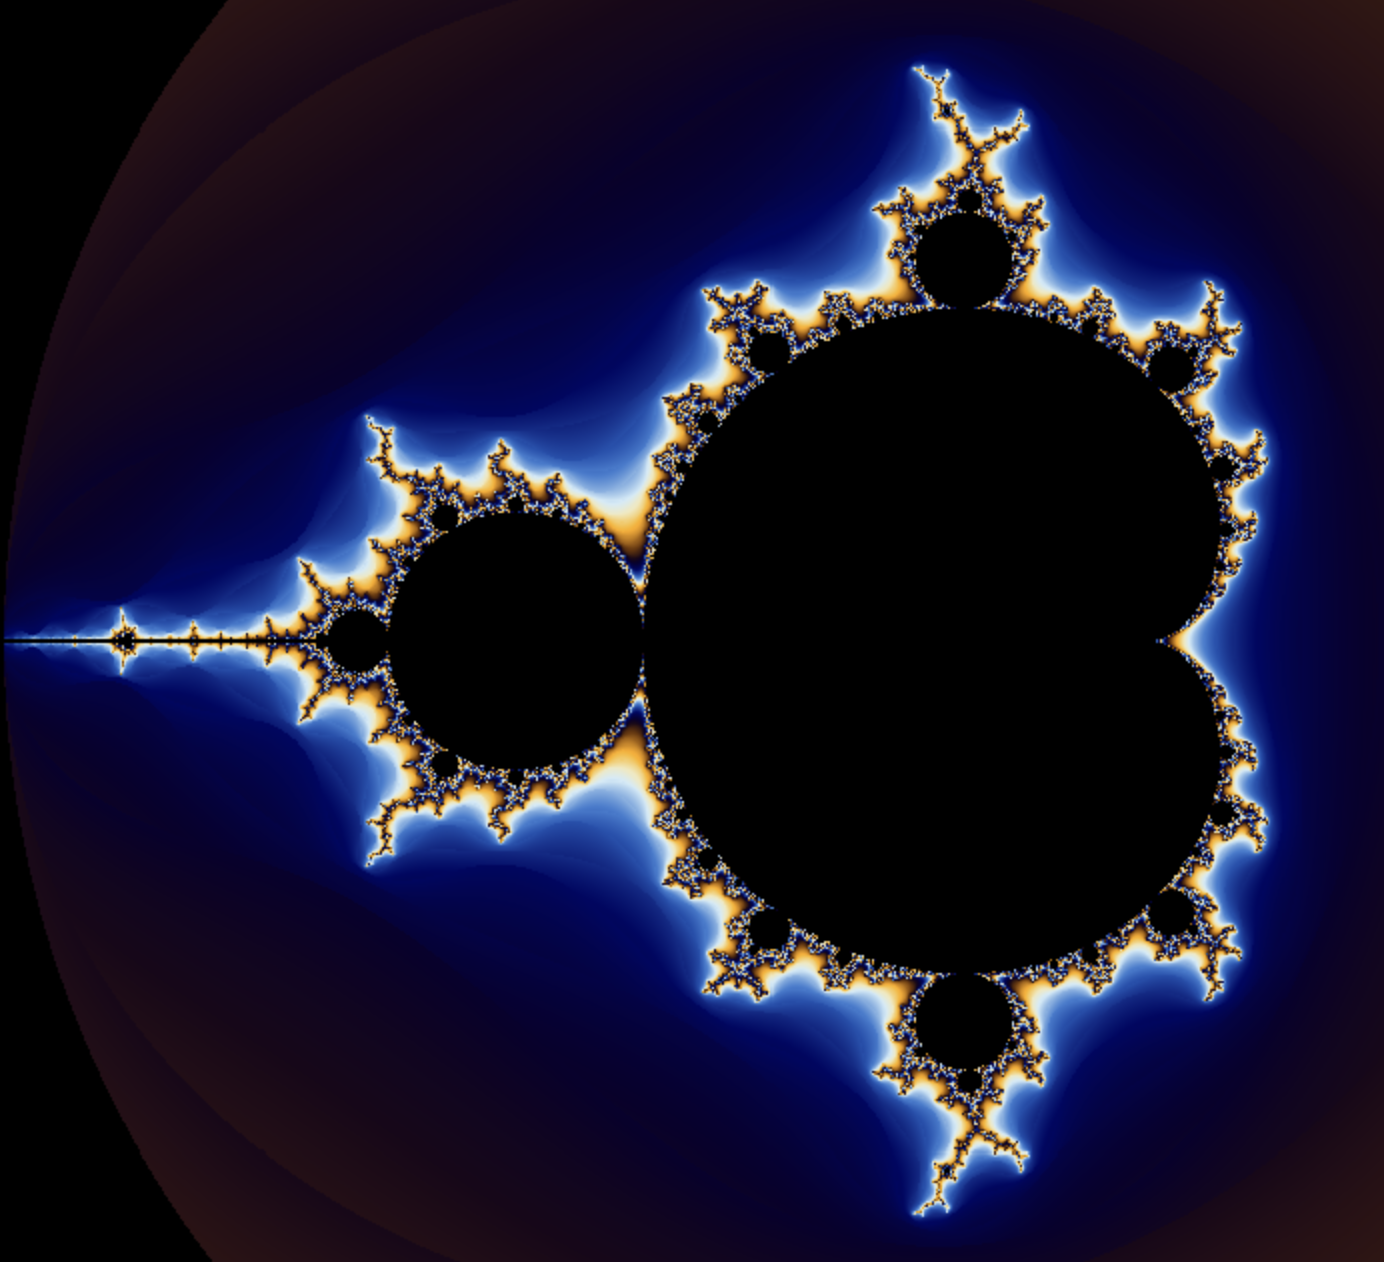
Much better!
Lo and Behold
After having seen how it works, it's time to bring it to the Internet. The excellent Rust and Webassembly book helps taking the first steps in wasm for Rust and even comes with a template project to quickstart. One of the most crucial crates of the project is wasm_bindgen. Let's step back a little and see why it is useful. There are two types of memories:
- The javascript heap stores Object, Arrays and DOM nodes
- The Wasm linear memory space holds Rust values
It is not a bi-directional communication: only Javascript can read and write to the Wasm linear memory space, with the constraint that the data must be an
ArrayBufferof scalar values. And here's wherewasm_bindgencomes to rescue: - one on hand, it boxes Rust structures and wraps the pointer in a Javascript object
- on the other, it indexes into a table of JavaScript objects from Rust
Armed with this, we can write our first version on the web, sort of like the first message on the Internet 3.
The javascript look like this:
import { mandelbrot } from "mandelbrot-webapp";

const canvas = document.getElementById("mandelbrot-canvas");
const ctx = canvas.getContext("2d");
canvas.height = window.innerHeight;
canvas.width = window.innerWidth;

const imageData = ctx.createImageData(canvas.width, canvas.height);
const data = imageData.data;

for(let px=0; px < canvas.width; px++){
	for(let py=0; py < canvas.height; py++){
		let pixel = mandelbrot(px, py, canvas.width, canvas.height);
		let r = (pixel >> 16) & 0xFF;
		let g = (pixel >> 8) & 0xFF;
		let b = pixel & 0xFF;

		let index = (py * canvas.width + px) * 4;
		data[index] = r;
		data[index + 1] = g;
		data[index + 2] = b;
		data[index + 3] = 255;
	}
}

ctx.putImageData(imageData, 0, 0);
where mandelbrot is the Rust method tagged with #[wasm_bindgen]. There are a few problems with this implementation:
- The result is not interactive, why having a web page if we are displaying a still image?
- Passing single pixels and returning one color between Rust and Javascript is inefficient, since there are a lot of copies. And the Rust+Wasm book is clear:
- Minimizing copying into and out of the WebAssembly linear memory. Unnecessary copies impose unnecessary overhead.
Both issues will be addressed in the next section.
More Interactivity
The first version worked but it was essentially a still image, why do a web page if it's just a static image right? So to make it more interesting the next step is to make it interactive, by letting users zoom and pan like in a map. In the mean time, also the inefficient interface between Rust and Javascript will be dealt.
After a bit of digging for similar projects (like the beautiful mandelbrot.site), I settled on using Leaflet.js to make my life easier. This library has a cool feature that lets you extend classes to essentially create your own maps and components.
In my case, as in the excellent tutorials, I needed to extend GridLayer, so then I can use a canvas to plot my image. The method to override is createTile and I've done it like this 4 :
createTile(coords: L.Coords, done: L.DoneCallback) {
	var wrapper = document.createElement('div');
	var canvas = document.createElement('canvas');
	const tile_size = this.getTileSize();
	const ctx = canvas.getContext("2d");

	if (!ctx) {
		console.error('Failed to get 2D context');
		done(new Error('Failed to get 2D context'), null);
		return null;
	}

	canvas.width = tile_size.x;
	canvas.height = tile_size.y;
	wrapper.style.width = tile_size.x + 'px';
	wrapper.style.height = tile_size.y + 'px';
	wrapper.appendChild(canvas);

	// Asynchronous tile creation
	// for some reasons that I dont know it needs to be this way
	setTimeout(() => {
		const {re : re_min, im : im_min} = this.tilePositionToComplexParts(coords.x, coords.y, coords.z);
		const {re : re_max, im : im_max} = this.tilePositionToComplexParts(coords.x+1, coords.y+1, coords.z);

		// Now it returns a Vec<u8>
		const data = mandelbrot_image(
			re_min,
			re_max,
			im_min,
			im_max,
			tile_size.x,
			tile_size.y
		);

		const imageData = new ImageData(
			Uint8ClampedArray.from(data),
			tile_size.x,
			tile_size.y
		);

		ctx.putImageData(imageData, 0, 0);

		done(null, wrapper);
	}, 10);

	return wrapper;
}
Nothing too strange about it, it is basically the same code as before but rewritten to fit the createTile specification. There are two things missing in this snippet. First of all, the function tilePositionToComplexParts (which I blatantly stole) converts the tile position given by Leaflet in the complex space:
private tilePositionToComplexParts(
	x: number,
	y: number,
	zoom: number
): { re: number; im: number } {
	const scaleFactor = this.getTileSize().x / 128;
	const d = 2 ** (zoom - 2);
	const re = (x / d) * scaleFactor - 4 + this.defaultPosition[0];
	const im = (y / d) * scaleFactor - 4 + this.defaultPosition[1];
	return { re, im };
}
The second thing you might have noticed is that the mandelbrot_image function changed, since now we pass the complex numbers directly. Furthermore, it returns not the single pixel, but the whole image:
#[wasm_bindgen]
pub fn mandelbrot_image(
	re_min: f64,
	re_max: f64,
	im_min: f64,
	im_max: f64,
	image_width: usize,
	image_height: usize,
) -> Vec<u8> {
	// generate grid of complex numbers
	let values_re = linspace(re_min, re_max, image_width); // reals on the x-axis
	let values_im = linspace(im_min, im_max, image_height); // imaginaries on the y-axis
	let mut image: Vec<u8> = vec![0; image_width * image_height * 4];

	for (y, im) in values_im.enumerate() {
		for (x, re) in values_re.clone().enumerate() {
			let index = (y * image_width + x) * 4;
			let pixel = get_mandelbrot_color(re, im);

			image[index] = ((pixel >> 16) & 0xFF) as u8;    // Red
			image[index + 1] = ((pixel >> 8) & 0xFF) as u8; // Green
			image[index + 2] = (pixel & 0xFF) as u8;        // Blue
			image[index + 3] = 255;                         // Alpha
		}
	}
	image
}
Finally, we can wrap things together by creating the map and assigning the layer to it:
import { init } from "mandelbrot-webapp";
import "leaflet/dist/leaflet.css";

(async () => {
	try {
	const { MandelbrotLayer } = await import('./layer');
	const L = await import('leaflet');

	try {
		init();
		var map = L.map('mandelbrot-map', {
			crs: L.CRS.Simple,
			center: [0, 0],
			zoom: 3,
			minZoom: 3,
			maxZoom: 20,
			zoomControl: true
		});

		const layer = new MandelbrotLayer([-0.5, 0]);
		layer.addTo(map);
		map.setView([-120.0, 130.0], 3);
	} catch (error) {
		console.error('Error in executing:', error);
	}
	} catch (error) {
		console.error('Error loading modules:', error);
	}
})();
and we are done! Working with Leaflet.js was surprisingly straightforward. There are lot of things still left to do:
- Address performance, mandelbrot's escape time algorithm is embarrassingly parallel and there are many other optimizations that could be done 5.
- Making it more customizable, like choosing the color palette or the algorithm parameters
- Making it more unique
- General SEO and webapp improvements
I already began tackling some of these, but for this post I think that's enough. If you want to see the status of the project, take a look at the repo or access the deployed version.