Components
Select Connection: INPUT[inlineListSuggester(optionQuery(#area)):connections]
Date Created: INPUT[dateTime(defaultValue(null)):Date_Created]
Due Date: INPUT[dateTime(defaultValue(null)):Due_Date]
Priority Level: INPUT[inlineSelect(option(1 Critical), option(2 High), option(3 Medium), option(4 Low)):Priority_Level]
Status: INPUT[inlineSelect(option(1 To Do), option(2 In Progress), option(3 Testing), option(4 Completed), option(5 Blocked)):Status]
Description
The first version worked but it was essentially a still image, why do a web page if it’s just a static image right? So to make it more interesting the next step is to make it interactive, by letting users zoom and pan like in a map.
After some searching (like the beautiful https://mandelbrot.site) I settled on using Leaflet.js to make my life easier. This library has a cool feature that lets you extend classes to essentially create your own maps and components.
In my case, as in the excellent tutorials, I needed to extend GridLayer, so then I can use a canvas to plot my image. The method to override is createTile and I’ve done it like this:
createTile(coords: L.Coords, done: L.DoneCallback) {
	var wrapper = document.createElement('div');
	var canvas = document.createElement('canvas');
	const tile_size = this.getTileSize();
	const ctx = canvas.getContext("2d");

	if (!ctx) {
		console.error('Failed to get 2D context');
		done(new Error('Failed to get 2D context'), null);
		return null;
	}

	canvas.width = tile_size.x;
	canvas.height = tile_size.y;
	wrapper.style.width = tile_size.x + 'px';
	wrapper.style.height = tile_size.y + 'px';
	wrapper.appendChild(canvas);

	// Asynchronous tile creation
	// for some reasons that I dont know it needs to be this way
	setTimeout(() => {
		const {re : re_min, im : im_min} = this.tilePositionToComplexParts(coords.x, coords.y, coords.z);
		const {re : re_max, im : im_max} = this.tilePositionToComplexParts(coords.x+1, coords.y+1, coords.z);

		const data = mandelbrot_image(
			re_min,
			re_max,
			im_min,
			im_max,
			tile_size.x,
			tile_size.y
		);

		const imageData = new ImageData(
			Uint8ClampedArray.from(data),
			tile_size.x,
			tile_size.y
		);

		ctx.putImageData(imageData, 0, 0);

		done(null, wrapper);
	}, 10);

	return wrapper;
}
There are two things missing in this snippet. First of all, the function tilePositionToComplexParts (which I blatantly stole lol) converts the tile position given by Leaflet in the complex space:
private tilePositionToComplexParts(
	x: number,
	y: number,
	zoom: number
): { re: number; im: number } {
	const scaleFactor = this.getTileSize().x / 128;
	const d = 2 ** (zoom - 2);
	const re = (x / d) * scaleFactor - 4 + this.defaultPosition[0];
	const im = (y / d) * scaleFactor - 4 + this.defaultPosition[1];
	return { re, im };
}
The second thing you might have noticed is that the mandelbrot_image function changed, since now we pass the complex numbers directly. Furthermore, it returns not the single pixel, but the whole image:
#[wasm_bindgen]
pub fn mandelbrot_image(
	re_min: f64,
	re_max: f64,
	im_min: f64,
	im_max: f64,
	image_width: usize,
	image_height: usize,
) -> Vec<u8> {
	// generate grid of complex numbers
	let values_re = linspace(re_min, re_max, image_width); // reals on the x-axis
	let values_im = linspace(im_min, im_max, image_height); // imaginaries on the y-axis
	let mut image: Vec<u8> = vec![0; image_width * image_height * 4];

	for (y, im) in values_im.enumerate() {
		for (x, re) in values_re.clone().enumerate() {
			let index = (y * image_width + x) * 4;
			let pixel = get_mandelbrot_color(re, im);

			image[index] = ((pixel >> 16) & 0xFF) as u8;    // Red
			image[index + 1] = ((pixel >> 8) & 0xFF) as u8; // Green
			image[index + 2] = (pixel & 0xFF) as u8;        // Blue
			image[index + 3] = 255;                         // Alpha
		}
	}
	image
}
Finally, we can wrap things together by creating the map and assigning the layer to it:
import { init } from "mandelbrot-webapp";
import "leaflet/dist/leaflet.css";

(async () => {
	try {
	const { MandelbrotLayer } = await import('./layer');
	const L = await import('leaflet');

	try {
		init();
		var map = L.map('mandelbrot-map', {
			crs: L.CRS.Simple,
			center: [0, 0],
			zoom: 3,
			minZoom: 3,
			maxZoom: 20,
			zoomControl: true
		});

		const layer = new MandelbrotLayer([-0.5, 0]);
		layer.addTo(map);
		map.setView([-120.0, 130.0], 3);
	} catch (error) {
		console.error('Error in executing:', error);
	}
	} catch (error) {
		console.error('Error loading modules:', error);
	}
})();
and we are done! This is the result for now:
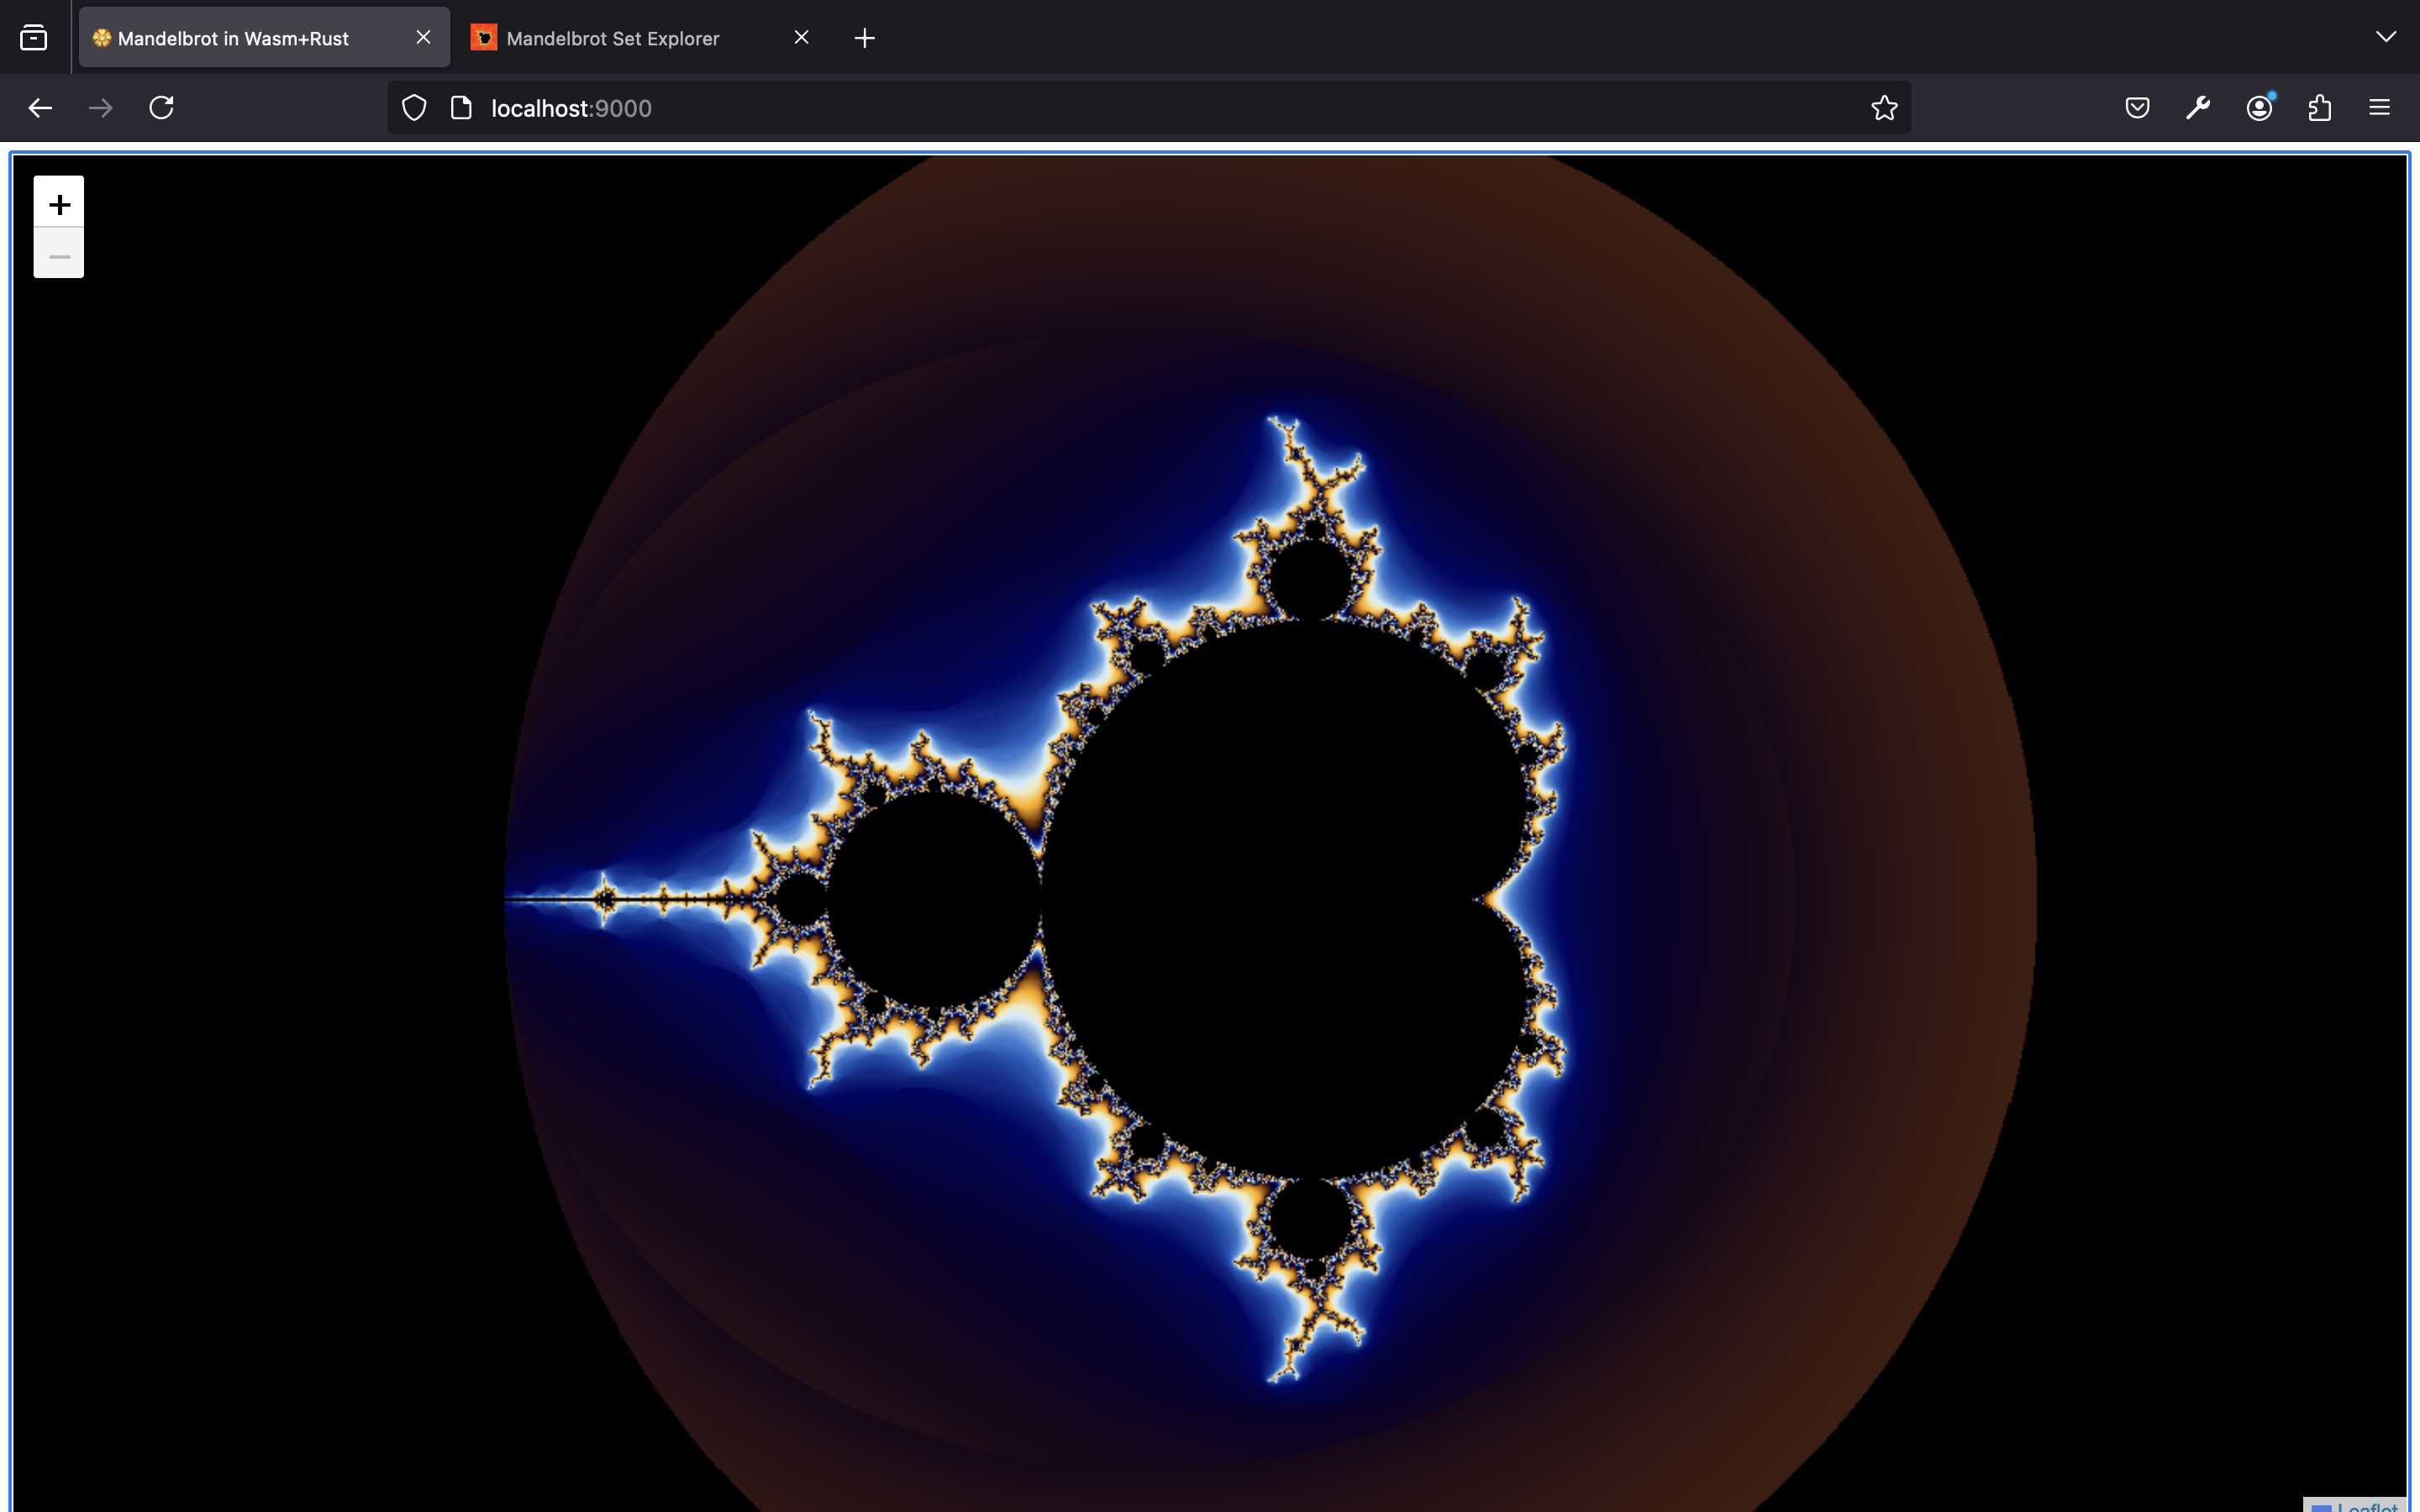 There are still a few problems though:
- its slow, making it a not so pleasant experience
- issues with the color scheme, when zooming it’s a mess and the outer parts should not be black we tackle this things one at a time, beginning from the speed.
Making it fast
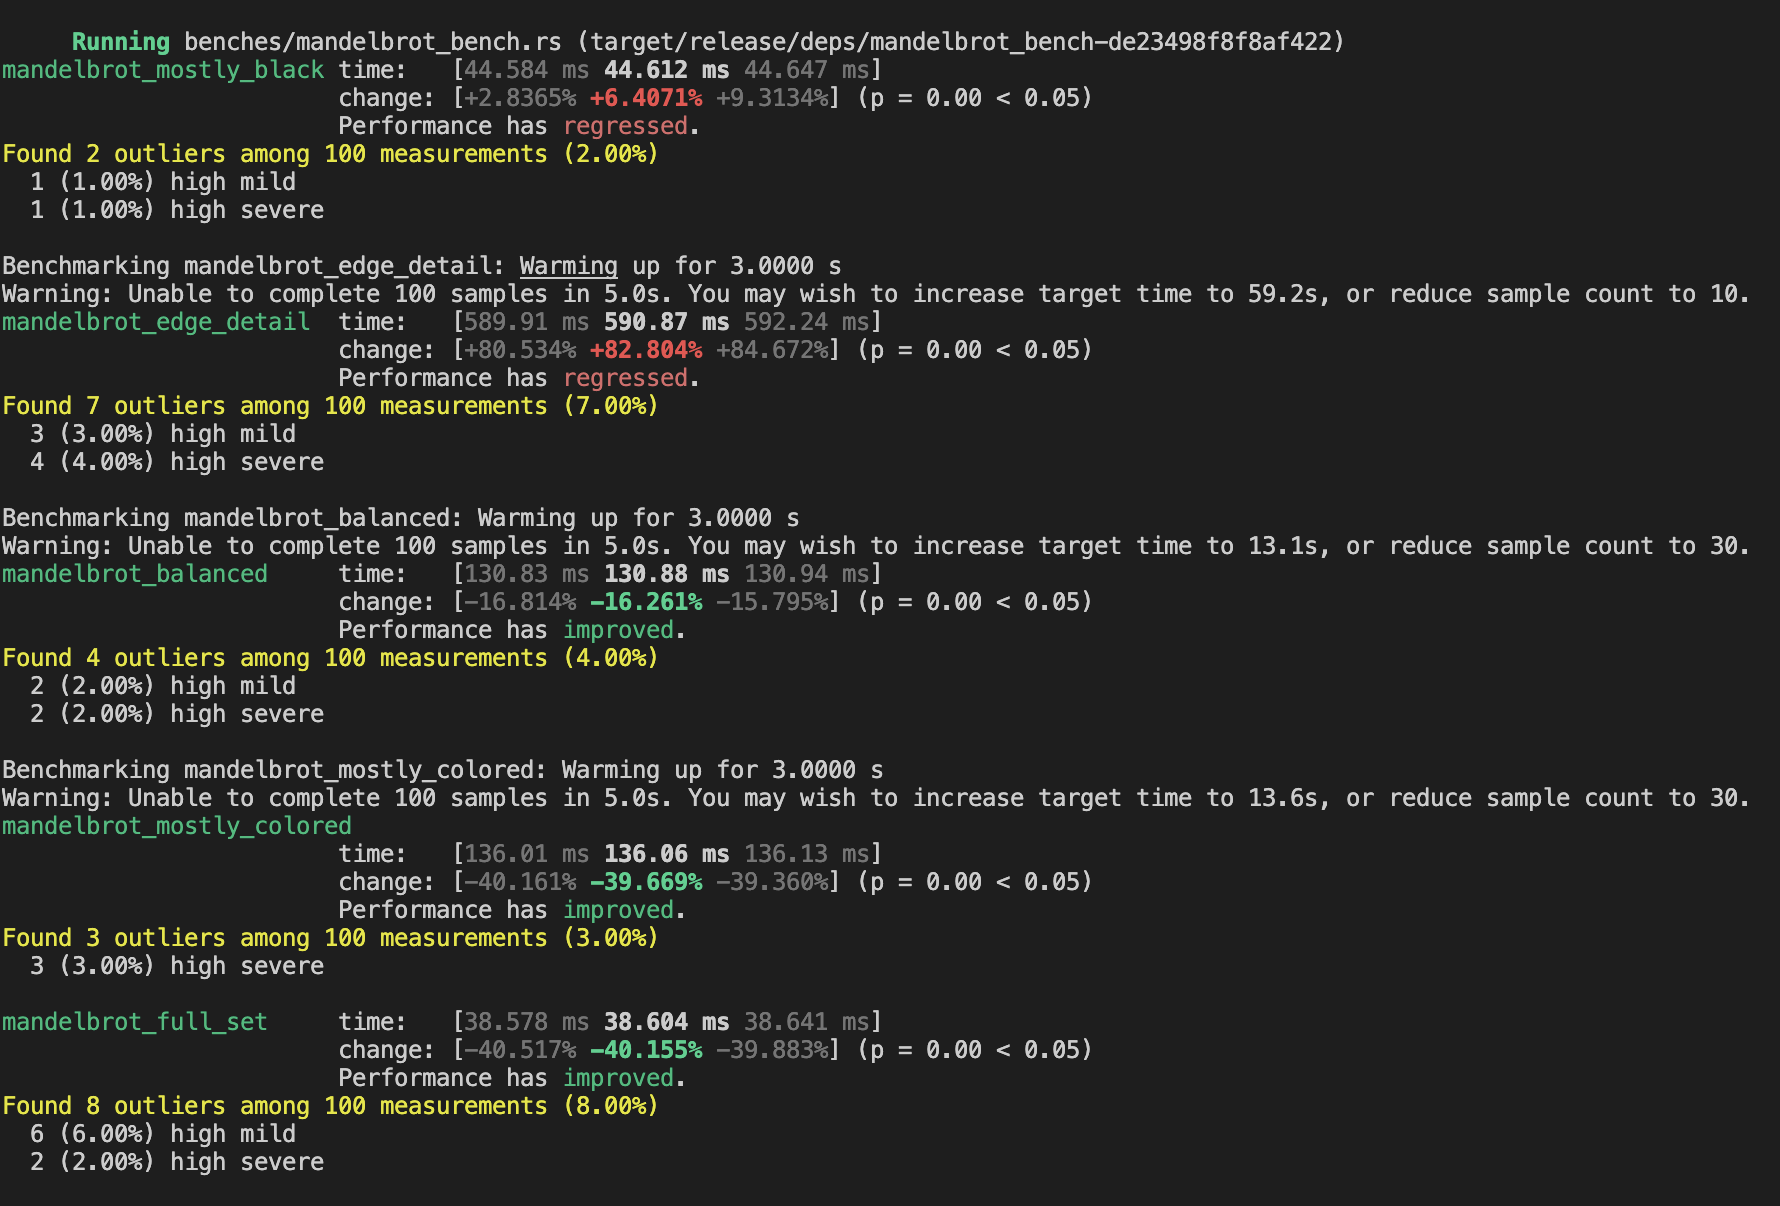
To tackle speed, first we need to make it measurable and make some tests. This is a great fit for the criterion.rs crate, a statistics-driven benchmarking library for Rust, which also allows to see how much performance has changed since last run. First of all, let’s setup the benchmark with some scenarios:
| name | re_min | re_max | im_min | im_max |
|---|---|---|---|---|
| mostly_black | -0.7 | -0.5 | -0.7 | -0.5 |
| edge_detail | -0.745 | -0.735 | 0.1 | 0.11 |
| balanced | -1.5 | -0.5 | -0.5 | 0.5 |
| mostly_colored | 0.2 | 0.4 | -0.1 | 0.1 |
| full_set | -2.0 | 1.0 | -1.5 | 1.5 |
| let’s see an example of results: | ||||
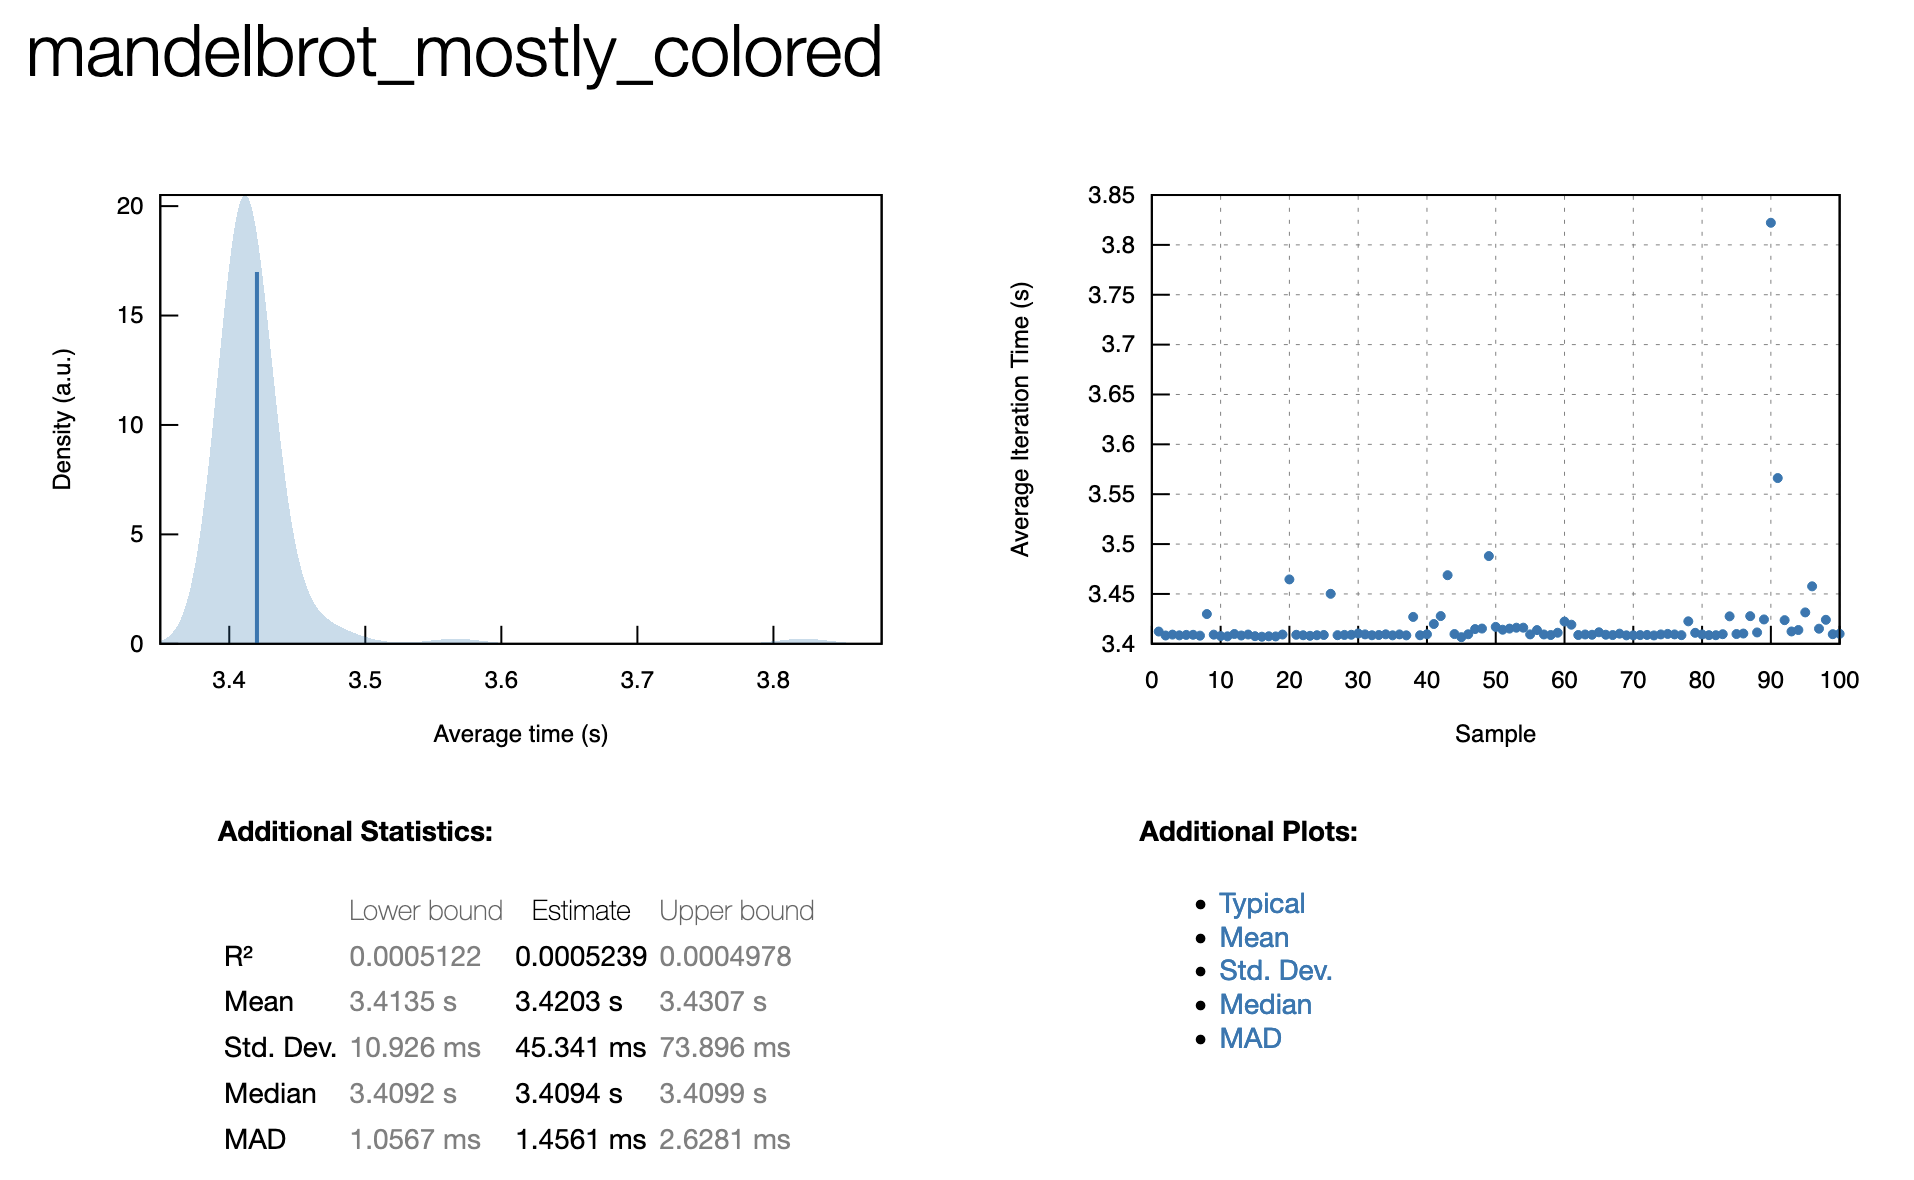 | ||||
| 3.4 seconds is definitely too much, we need to bring it down. |
Orbit Detection
https://mrob.com/pub/muency/orbitdetection.html
with this method the performance are mixed: